|
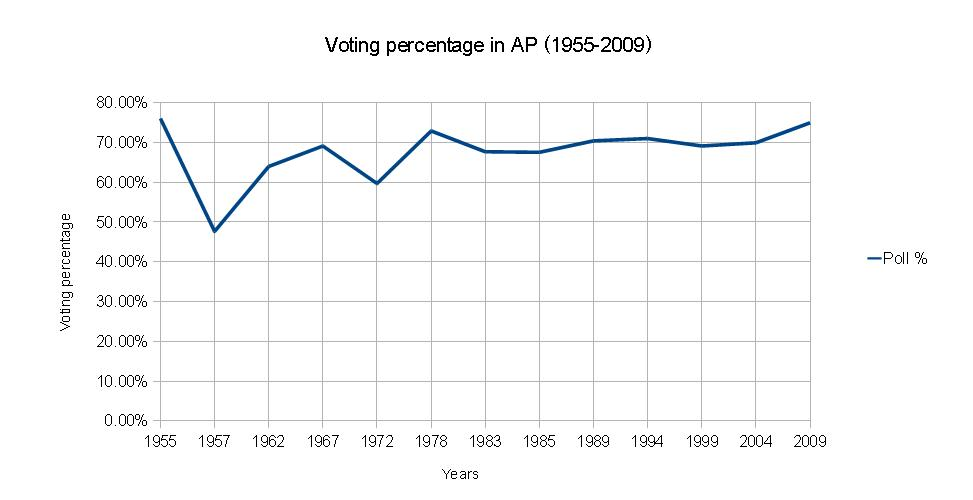
Voting Percentage in Andhra Pradesh |
||||
|
Year |
Total No.Of Assembly Seats |
Electors |
Voters |
Poll % |
|
1955 |
167 |
1,13,36,618 |
86,24,842 |
76.07% |
|
1957 |
85 |
75,58,880 |
36,03,585 |
47.67% |
|
1962 |
300 |
1,90,07,856 |
1,21,65,283 |
64.00% |
|
1967 |
287 |
2,09,34,068 |
1,44,76,108 |
69.15% |
|
1972 |
287 |
2,46,07,903 |
1,46,93,030 |
59.71% |
|
1978 |
294 |
2,83,86,334 |
2,06,9,8,706 |
72.92% |
|
1983 |
294 |
3,18,46,694 |
2,15,60,642 |
67.70% |
|
1985 |
294 |
3,45,87,372 |
2,33,70,750 |
67.57% |
|
1989 |
294 |
4,24,48,805 |
2,98,99,530 |
70.44% |
|
1994 |
294 |
4,47,25,091 |
3,17,63,466 |
71.02% |
|
1999 |
294 |
4,96,54,389 |
3,43,34,842 |
69.15% |
|
2004 |
294 |
5,11,46,498 |
3,57,80,385 |
69.96% |
|
2009 |
294 |
5,71,87,207 |
4,28,90,405 |
74.99% |
|
2014 |
295 |
6,23,85,901 |
||
- Voting percentage in India
- Your Vote Can Make a Difference in Electing the Leader for Next Five Years
- Watch out for Influences that Manipulate you to Vote Against Your Interest
- Politics Quotations with Wisdom
- Clever Quotations on Politics
- Sarcastic Quotations on Politics

